Categories
Uncategorized

Week 6

Data Collection: desk research and online open data

This week Maaike noticed that Frank sits on a new wobbly chair, which is better for his back, but maybe not appropriate for video recordings 🙈. But let’s focus on this week’s instructions !

We hope you caught up with all the exercises and tasks. We have adjusted the general schedule a bit to give everybody some breathing space. There is a new exercise for you, and Laurens shares how he searches for and collects data on his dog, Rocca đŸ¶.

So here is our partly wobbly instructional video below:

Instruction video CCDL week 6

Transcription of this video.

Your question to fellow students:
https://forms.gle/3sAjcoAXW6skeyys6

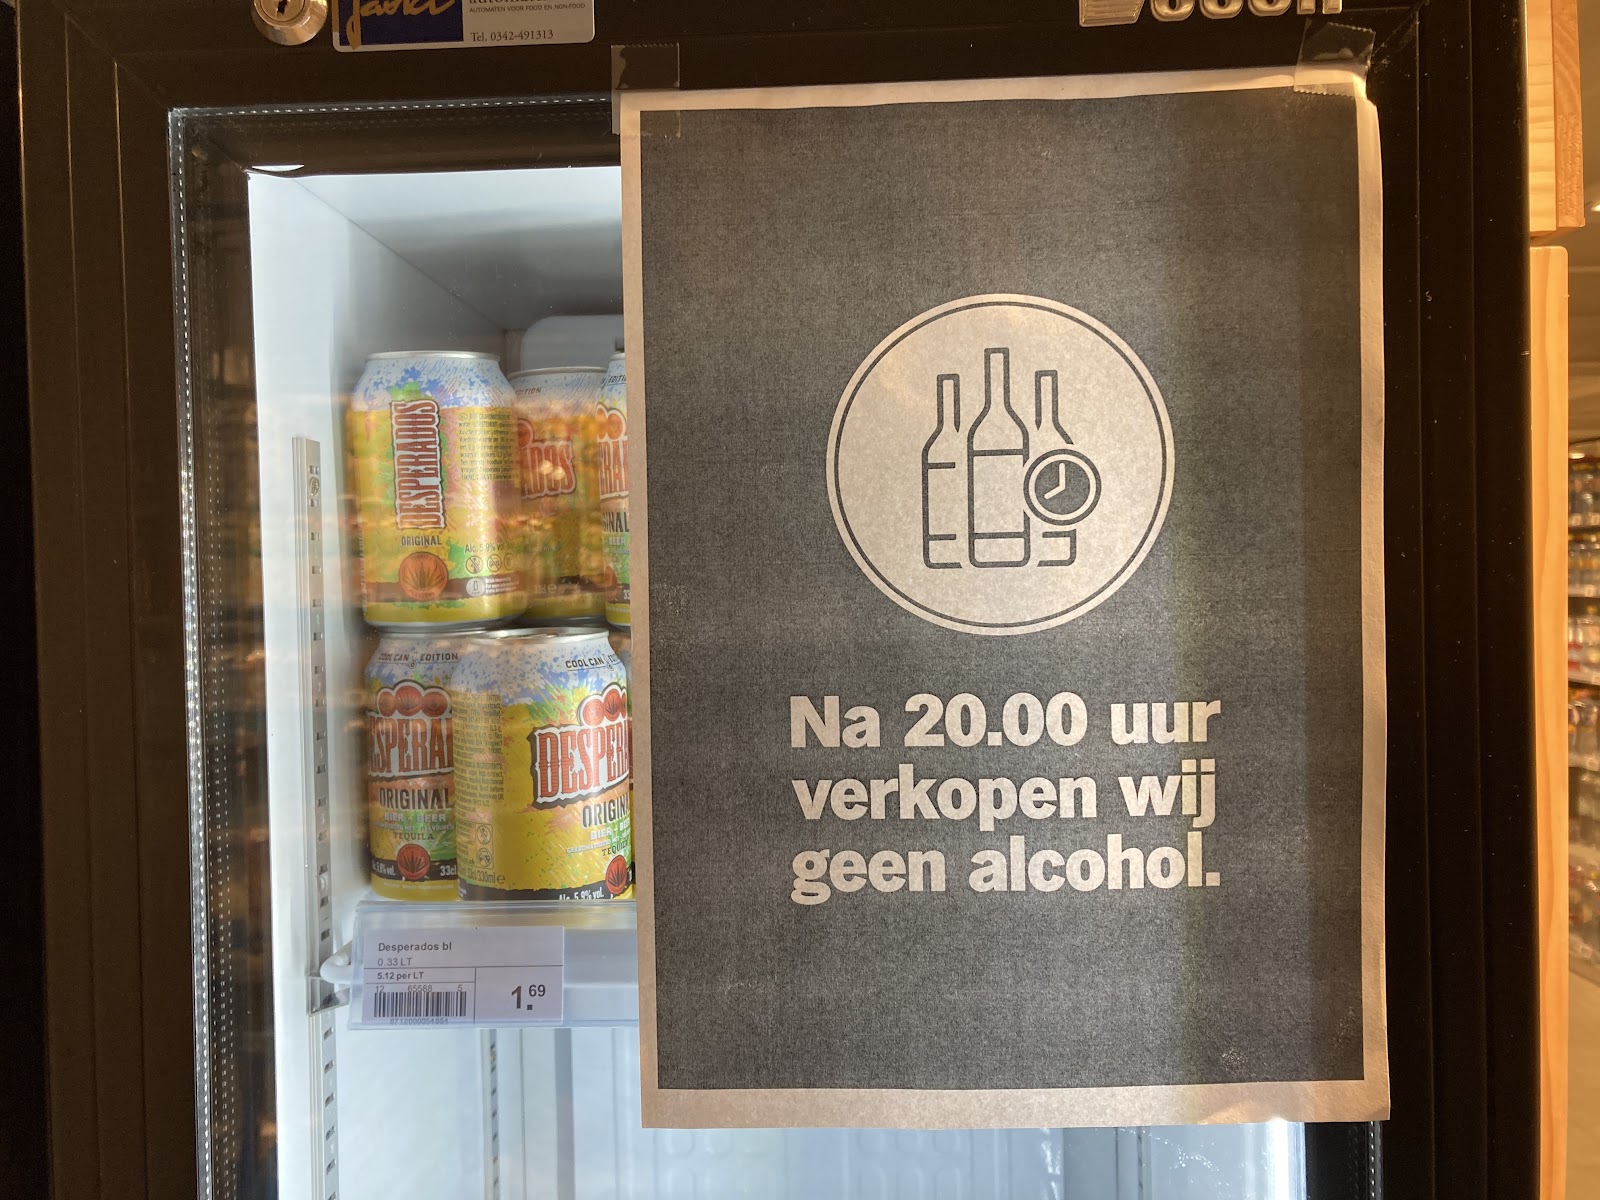
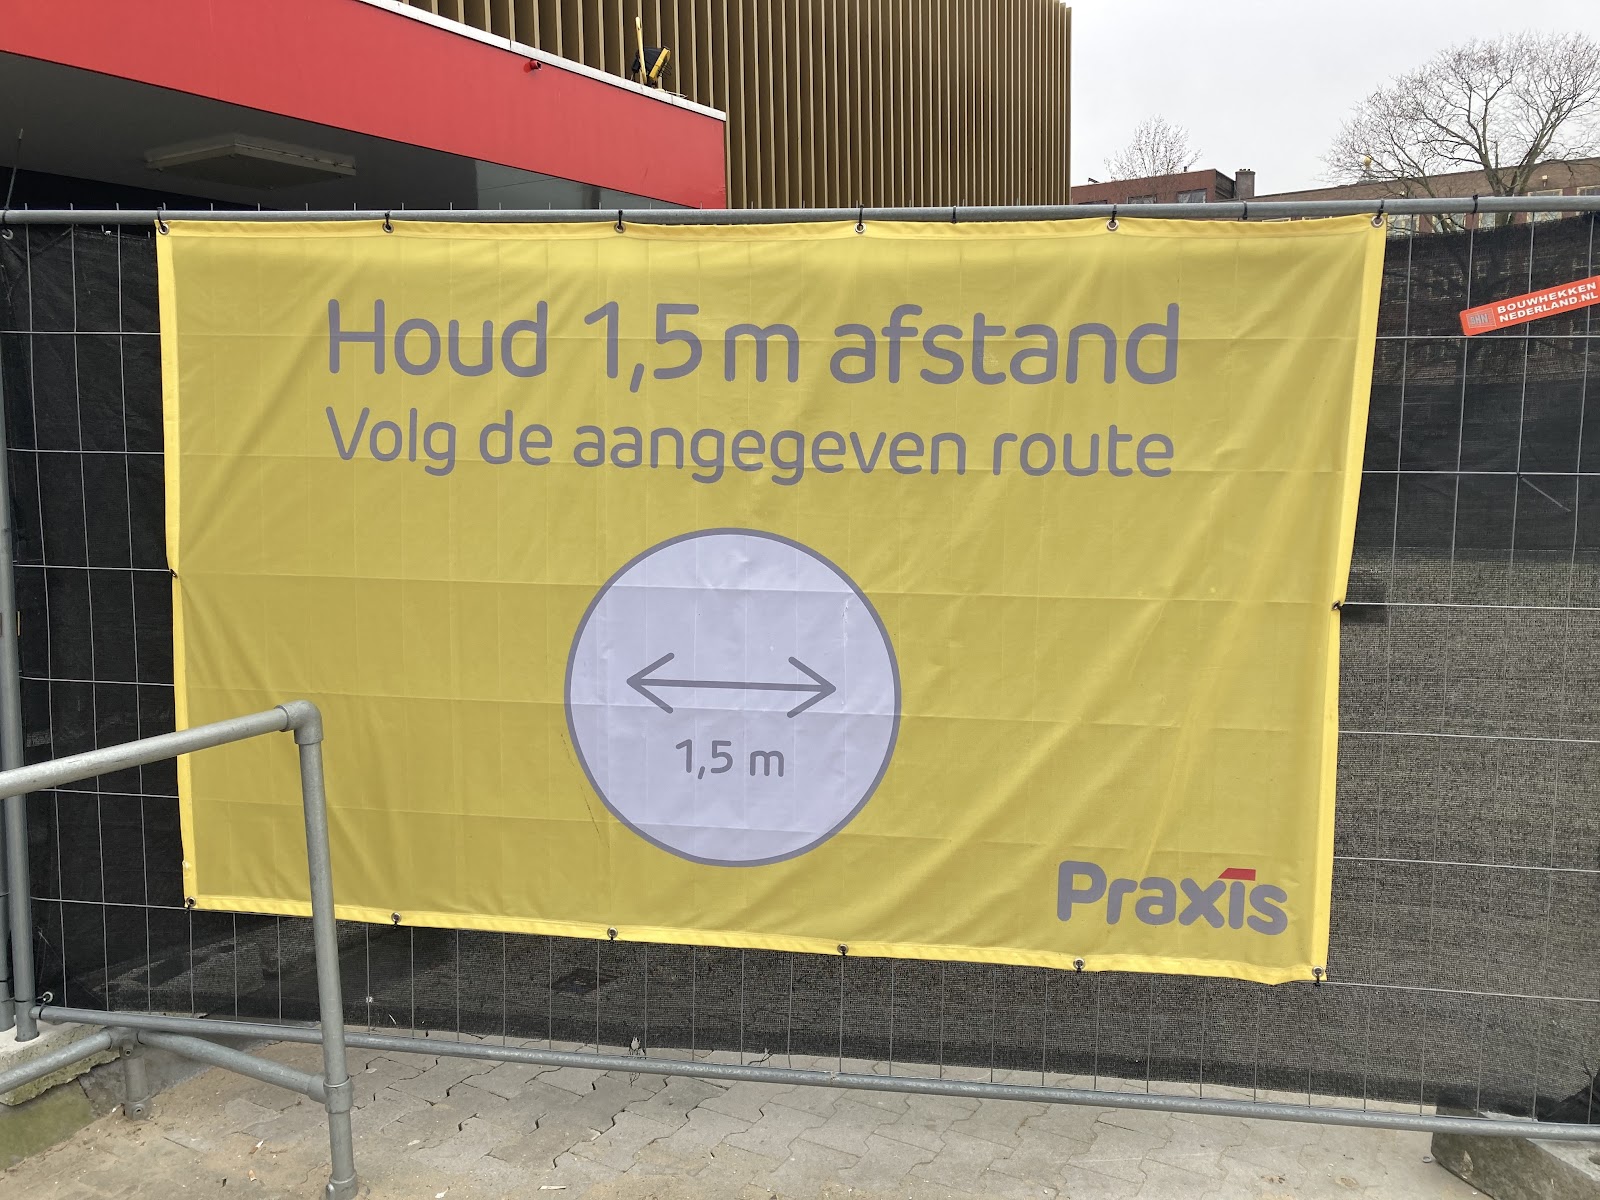
Last week’s Exercise
Data Collection Exercise 1 COVID Signs
http://crossculturaldataliteracy.org/2021/03/01/week-5/

Guest Lecture by Laurens Aarnoudse
Finding and Exploring Data:
https://github.com/cross-cultural-data-literacy/2021-good-health-and-wellbeing/blob/main/resources/finding-and-exploring-data.md

Part 1
Part 2
Part 3
Part 4

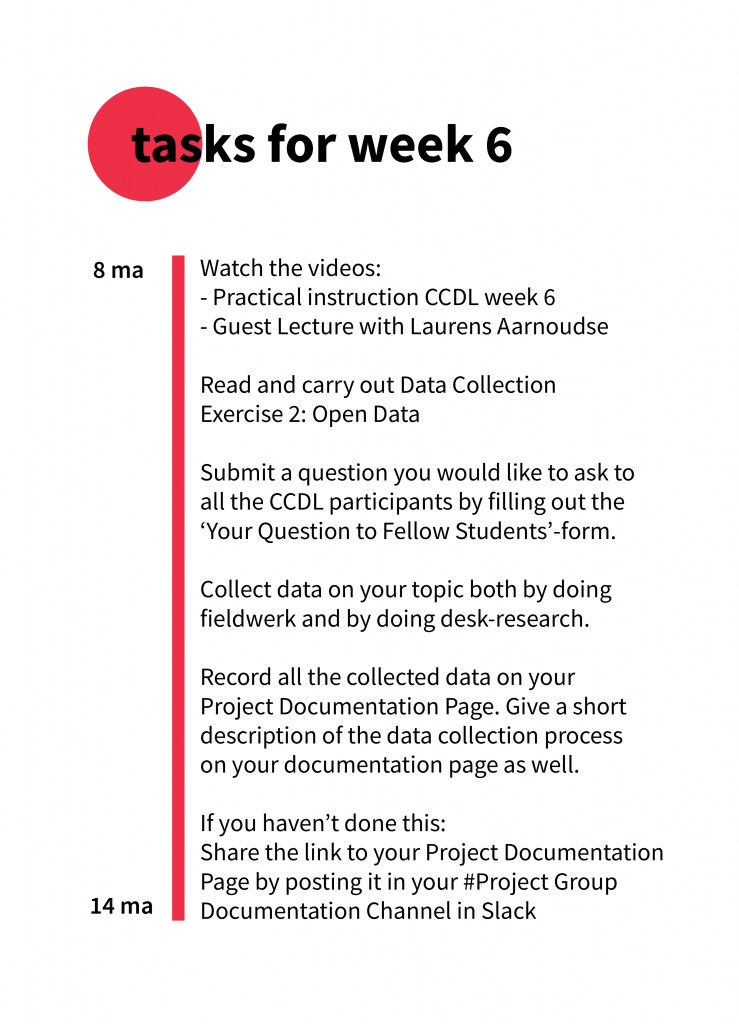
Data Collection Exercise 2: Open Data
search for datasets on your topic
share the links to the sources on #data-sources channel on Slack, and write a description
– also put this on your project documentation page (notion, dropbox paper, etc)

Resources and links to data sources:
https://data.unicef.org/topic/child-health/immunization/
https://www.who.int/data/collections
https://ourworldindata.org/covid-vaccinations
https://data.worldbank.org/topic/health
https://centre.humdata.org/
https://data.humdata.org/
https://unstats.un.org/sdgs/indicators/database/

Categories
Uncategorized

Week 5

Catch Up week!
(And a data collection exercise.)

Catch Up week!

Transcription:
https://docs.google.com/document/d/1iGQ7mUoqqKBPDPxyPX0C85_ByvC0KAvAP7J31ITSAeI/edit?usp=sharing

If you are on track, carry on with data collection, and read the guidelines in the document in which Laurens explains what kind of tools you can use to analyse your data.
https://github.com/cross-cultural-data-literacy/2021-good-health-and-wellbeing/blob/main/resources/finding-and-exploring-data.md


You can collect data in your environment about any topic. What’s important when collecting data is that you set a couple of rules you follow while collecting. This week’s exercise is to collect data on COVID instructions and signs in your environment.

Exercise instruction:
Look in your neighbourhood for instructions or signs on how to behave during the COVID 19 Pandemic.
Collect 10 different signs / instructions you can find in public space, this can be in a shop, on the street, etc.. It can be an instruction to wear a face mask or a sign to enter a shop with maximum of 2 people or a signs to remind you to wash your hands.

Collect this information / data:
-A picture of the sign / instruction
-The text that’s on it in the original language and English translation
-Material: is the sign handwritten or printed? In color or black and white?
-Location: where did you find the sign / instruction?
-Type location: what type of location is this (a shop, a bus stop, etc
)

Collect your data in one document (Word document, hand-written, Google docs) and post the document in Slack.

Good luck and have fun collecting!

Example 1:


Text: Na 20:00 verkopen wij geen alcohol / After 8 pm we do not sell alcohol
Material: A4 print from a copier in black / white
Location: Albert Heijn Science Park, Molukken Straat 308, Amsterdam
Coordinates:52.357454, 4.939166
Type Location: supermarket

Example 2:


Text: Houd 1,5m afstand, Volg de aangegeven routel / Keep 1,5 meter distance. Follow the indicated route
Material: high quality printed banner, very big (1 by 2 meters)
Location: Praxis hardware store, Molukkenstraat 190, 1098 TW Amsterdam
Coordinates: 52.357739, 4.939239
Type Location: Parking lot of hardware store

Categories
Uncategorized

Week 4

Looking around #2: observation and data collection in your neighbourhood

Another week of observation! Last week you mapped your own room in a drawing, this week we ask you to go outside and draw your neighbourhood. Try to look at your surroundings through the eye of a detective: what are the things you normally take for granted, but can provide the viewer with information about your neighbourhood? This is qualitative visual data!

But first, take a look at our instructional video below:

Instructions for week 4

Transcription of this video: https://bit.ly/3aJy538

Jan Rothuizen gave you an assignment last week to draw your own room. In the next video he tells us a bit more about his own work, below this video you can find this week’s second drawing exercise Draw your own Neighbourhood:

Guest lecture by Jan Rothuizen
Draw your own neighbourhood exercise

The last video this week is an interview with Lennart, a student from Amsterdam. He made a data visualisation about what people from around the world store in their fridges. Lennart is a student with some technical skills and experience, so do not be intimidated by his work! We do not expect that you can make something like this, it is just an example of what you can do with data.

The World Fridge data visualisation by Lennart

Resources and links:
Dear Data. a project by data designers Giorgia Lupi and Stefanie Posavec: http://www.dear-data.com/theproject

Watch this talk where Giorgia and Stefanie present the Dear Data project and explain how they did it and what they encountered during the project:

The Seinfeld Chronicles, personal project by Andy Kirk:

https://www.visualisingdata.com/2020/09/new-project-the-seinfeld-chronicles/

Jan Rothuizen:

https://janrothuizen.nl/projects/

Nicholas Feltron
http://feltron.com/
http://feltron.com/FAR13.html (speach)
http://feltron.com/FAR07.html (music)
http://feltron.com/FAR09.html (food and drink)

Bloomberg City Lab: How 2020 Remapped Your Worlds
https://www.bloomberg.com/features/2020-coronavirus-lockdown-neighborhood-maps/

Other links, mentioned in the videos:
Dollar Street: https://www.gapminder.org/dollar-street
Our World in Data: https://ourworldindata.org/
Svelte Javascript Framework: https://svelte.dev/
https://svelte.dev/tutorial/basics

Categories
Uncategorized

Week 3

Looking around: observation and data collection

Looking Around 
This week we ask you to look around! If you know what your subtopic is you will be working on, you can start looking around for data. But don’t worry if you’re not ready for data collection yet (if you don’t have an idea which topic to address). By looking around and observing your own environment you can get ideas as well.

To get you going, we ask you to do an Observation Exercise, brought to you by Jan Rothuizen. Jan is a Dutch artist and a great observer. He draws maps of his environment and the places he visits. Check out Observation Exercise 1! It’s a quick exercise which you can do in an hour. You can see the instructions in the video below:

Observation Exercise

Share the finished drawing in the chat channel of your project group!

Data collection and Qualitative Data

There are different kinds of data you can collect and visualise to give insight in your topic. In this week’s Guest Lecture information designer Andy Kirk explains which kinds of data you could use and how qualitative data are collected and visualised.

Guest lecture by Andy Kirk

The second part of the Guest Lecture is an interview we did with Andy. We asked him where and how to start collecting data for your project. Hopefully it will give you inspiration to start.

Interview with Andy kirk

Tasks for Week 3

Categories
Uncategorized

Week 2

Welcome to the second week of our project!

In this video we would like to address some questions that have arisen from you, give some detailed descriptions of what the next steps are and explain the task for the end of this week.

Tasks for week 2

Examples of project documentation page:
https://paper.dropbox.com/doc/Project-Documentation-Page–BEKyveuuv~2nBVv56XmXxhRpAg-69JiZsc24afpiFrsvMpvw

https://eva-janssen2.gitbook.io/ccdl-eva-janssen/week-1

Dropbox Paper: https://paper.dropbox.com/
Notion: https://www.notion.so/product
Gitbook: https://www.gitbook.com/

This week’s guest: Maarten Lambrechts!

Maarten Lambrechts part 1
Maarten Lambrechts part 2
Maarten Lambrechts part 3

You can find the slides of Maarten’s presentation here:
http://slides.com/maartenzam/cc-datalit

Here is a great interview with Maarten about the work he did for the Worldbank:
https://medium.com/nightingale/visualizing-the-sustainable-development-goals-5f3b1469f13b

Categories
Uncategorized

Guest lecture 1: Alberto Cairo

Alberto Cairo is a journalist and designer, and the Knight Chair in Visual Journalism at the School of Communication of the University of Miami (UM). He is also the director of the visualization program at UM’s Center for Computational Science. He has been head of information graphics at media publications in Spain and Brazil. 

The author of several textbooks, Cairo currently consults with companies and institutions like Google and the Congressional Budget Office, and has provided visualization training to the European Union, Eurostat, the Centers for Disease Control and Prevention, the Army National Guard, and many others. He lives in Miami, Florida.

Slides of Alberto Cairo’s talk:
https://www.dropbox.com/s/qmxlkx6xh0lcybc/AmsterdamDataVisualizationLiteracy.pdf?dl=0

Categories
Uncategorized

Kick-off!

Dear students,
Thank you for your patience while we were assembling teams from applicants from all corners of the world! It is overwhelming to see so many people getting excited and ready for this project. Here is our kick-off video for you where we start our project:

Welcome video

All the stuff we talked about in this video:
Giorgia Lupi, article on Data Humanism: http://giorgialupi.com/data-humanism-my-manifesto-for-a-new-data-wold

Giorgia Lupi conference talk (video), Finding Humanity in Data: https://www.youtube.com/watch?v=IYRhCZ0vvFQ

Examples of Project Documentation Page:
Dropbox Paper: https://paper.dropbox.com/
Notion: https://www.notion.so/product
Gitbook: https://www.gitbook.com/

Data Visualization Society: https://www.datavisualizationsociety.com/

Nightingale, Medium: https://medium.com/nightingale
Outlier Conference: https://www.outlierconf.com/

Categories
Uncategorized

Enrolment form

Here you can indicate on which topic you would like to work and which skills and expertises you would like to develop.

We will use this information to form balanced topic-groups of people to work in, based on your preferences. 

Please, don’t worry if you don’t have a specific idea for a topic, in the first weeks of the project we will take some time to refine your topic and project plan. With this form you also have the opportunity to suggest any angle or topic you find interesting.

https://forms.gle/9PvKCPUtZJruSS1V6

Categories
Uncategorized

Enrolment and kick-off

Hello everyone! This is the place to be for all the latest updates and information. Our first post is an overview of the enrolment procedure and the kick-off: