Looking around #2: observation and data collection in your neighbourhood
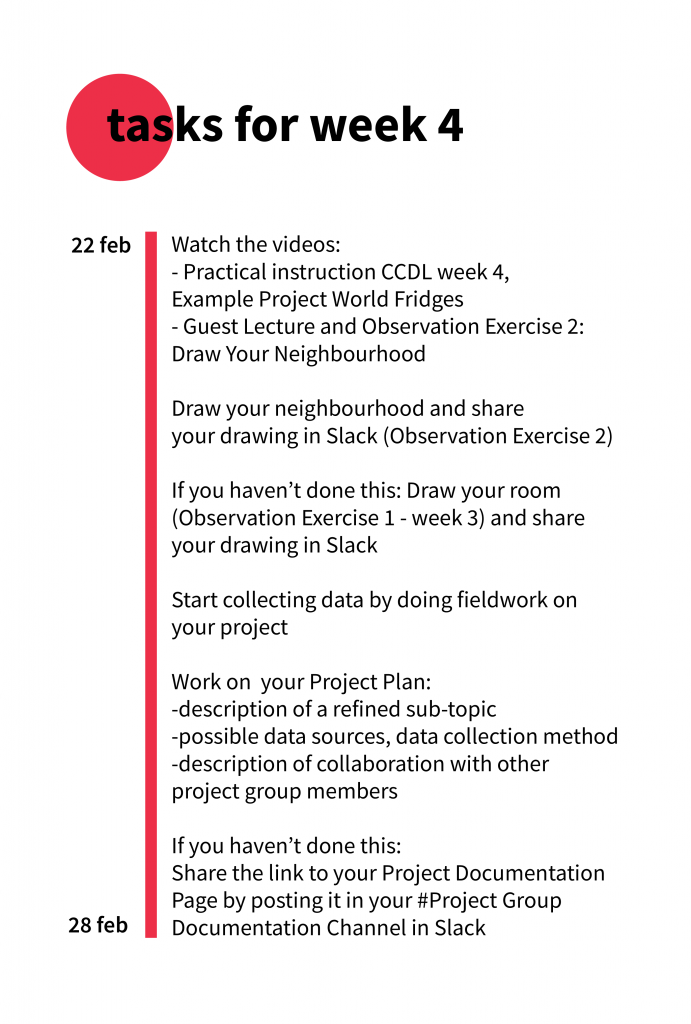
Another week of observation! Last week you mapped your own room in a drawing, this week we ask you to go outside and draw your neighbourhood. Try to look at your surroundings through the eye of a detective: what are the things you normally take for granted, but can provide the viewer with information about your neighbourhood? This is qualitative visual data!
But first, take a look at our instructional video below:
Transcription of this video: https://bit.ly/3aJy538
Jan Rothuizen gave you an assignment last week to draw your own room. In the next video he tells us a bit more about his own work, below this video you can find this week’s second drawing exercise Draw your own Neighbourhood:
The last video this week is an interview with Lennart, a student from Amsterdam. He made a data visualisation about what people from around the world store in their fridges. Lennart is a student with some technical skills and experience, so do not be intimidated by his work! We do not expect that you can make something like this, it is just an example of what you can do with data.

Resources and links:
Dear Data. a project by data designers Giorgia Lupi and Stefanie Posavec: http://www.dear-data.com/theproject
Watch this talk where Giorgia and Stefanie present the Dear Data project and explain how they did it and what they encountered during the project:
The Seinfeld Chronicles, personal project by Andy Kirk:
Jan Rothuizen:
Nicholas Feltron
http://feltron.com/
http://feltron.com/FAR13.html (speach)
http://feltron.com/FAR07.html (music)
http://feltron.com/FAR09.html (food and drink)
Bloomberg City Lab: How 2020 Remapped Your Worlds
https://www.bloomberg.com/features/2020-coronavirus-lockdown-neighborhood-maps/
Other links, mentioned in the videos:
Dollar Street: https://www.gapminder.org/dollar-street
Our World in Data: https://ourworldindata.org/
Svelte Javascript Framework: https://svelte.dev/
https://svelte.dev/tutorial/basics
