Only 5 more weeks to go!
Guest lecture Tiffany France
We have a lecture for you about the design part of data visualisation. It’s a crash course on the use of typography, brought to you by designer and teacher Tiffany France. It’s very practical and very informative. In half an hour you kind of know everything you need to know about typography to make a data visualization.
The coming weeks
Presentation and feedback rounds
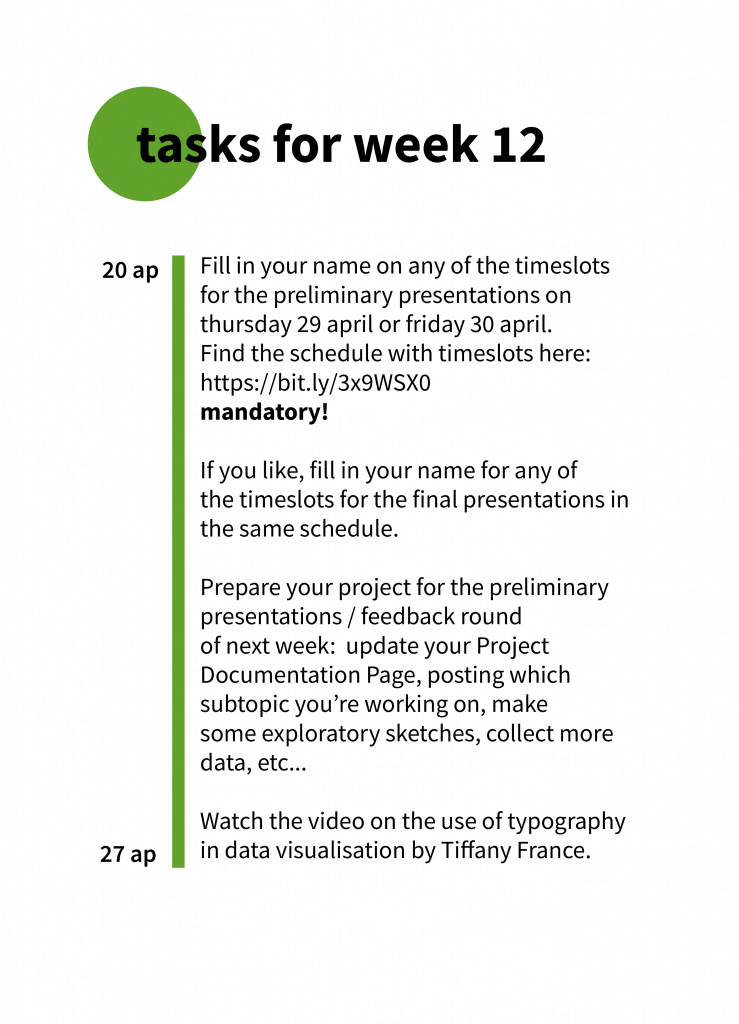
If you would like to receive an official Certificate of Participation from the Amsterdam University of Applied Sciences, we would like to invite you to our presentation rounds on April 29 and 30 and the final presentations on May 27 and 28.
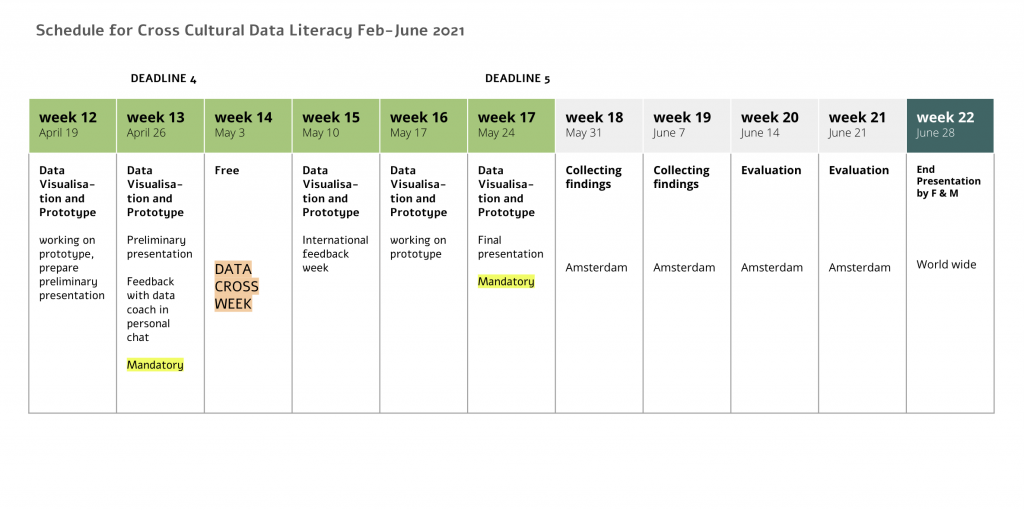
It’s mandatory you participate in these presentations, if you want to complete the project. We made as much as time slots to make it possible to join form every timezone but suppose you can’t make it on any of these times, let us know and we can work something out.
During the preliminary presentations and feedback rounds you show how far you got on the data collection, sketches and prototype of your data topic. Don’t worry if your visualisation isn’t finished, it’s work in progress and just a chance to get feedback on your ideas and your work. After that you have four more weeks to work on your project till the final presentations.
Final Presentations
The final presentations are on Thursday May 27 and Friday May 28. We also have made time slots for these. You can also present as a team!
Link to the schedule with preliminary and final presentations:
https://bit.ly/3x9WSX0