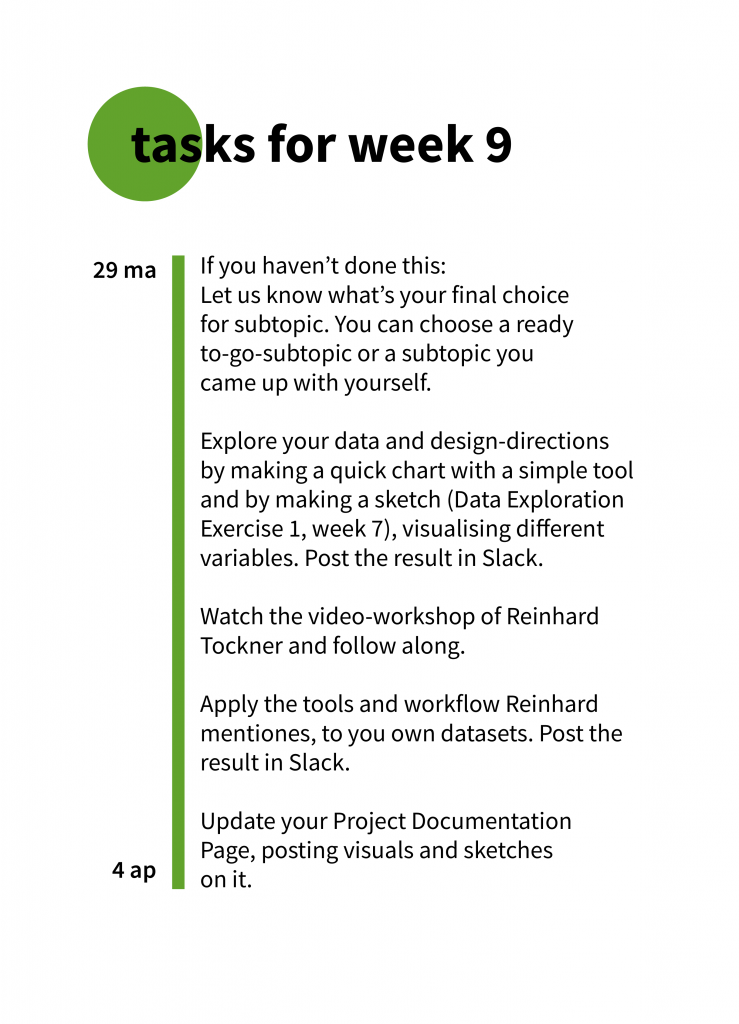
Reinhard Tockner workshop: Rebuilding Hans Rosling’s viz with recent data and FREE TICKETS.
This week we have a hands-on workshop for you from data vis teacher Reinhard Tockner from Austria. He’s showing you some tools you can use to explore, transform and visualise data.
Rebuilding Hans Rosling’s viz with recent data:
TedTalk with Hans Rosling:
Sources for data:
https://data.worldbank.org/
Gapminder data
https://data.oecd.org/
Cleaning up data with Microsoft Excel (for Windows):
Cleaning up data with Exploratory.io (for Mac):
Using Tableau to make the visualization:
Tableau is software to make (interactive) data visualizations
https://www.tableau.com/
As a student you can use for free:
https://www.tableau.com/academic/students
Free tickets for S-H-O-W 8 & 9 April
Do you want to join an online conference about data visualisation and impact? The super friendly organiser from the conference S-H-O-W (8 & 9 April) is offering free tickets for CCDL students! Check out the program and speakers.
Note that the event is a live stream and takes place between 1:00pm – 8:00pm Amsterdam time (GMT+2). Do check when this is in your time-zone because you can only watch it live (it’s not pre-recorded).
If you like to join S-H-O-W, please let us know by sending a e-mail to Maaike (m[dot]van[dot]cruchten[at]hva[dot]nl) and answer these questions:
- Which days would you like to join? 8 April, 9 April or both?
- What do you hope to get out of it? (super short motivation in one or two sentences)